Since GA4 was first introduced, a commonly touted benefit was the ability to export the raw event-level data, and create your own analysis with that data. This is amazing! We were finally able to customise every part of our reporting. We could also easily join the data with other data sources.
In this article, I discuss a dbt pipeline I have built to transform the raw GA4 data export into a usable star schema data model.
Why I built this
I wanted to build a dashboard using Power BI with the GA4 data I have collected on this site (https://lesnich.com). Since my site doesn’t get much traffic, there isn’t much data. However, having the flexibility in the way I visualise my data sounded like a fun project.
For this report to work, and be flexible, I needed the model to follow proper dimensional modelling techniques. Since the transformations necessary would be highly interconnected, I decided to use one of my favourite tools: dbt. It would allow me to build, test, and run my model whilst handling the dependencies of each step.
Solutions architecture
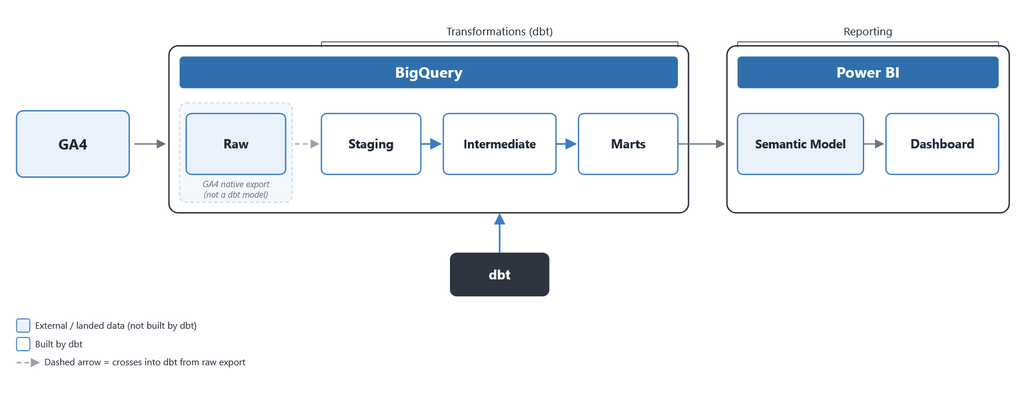
Above is the overall diagram of the pipeline.
- GA4 pushes its raw event data straight into BigQuery through the in-built connector, with no dbt transformations needed.
- Everything after that is where dbt takes over:
- staging cleans up and standardises the raw event stream
- the intermediate layer does the heavier lifting (working out sessions, resolving identity, handling all the awkward edge cases)
- and the marts are the actual star schema that Power BI would eventually connect to.
- I then plan to get the data from BigQuery and pull it into a Power BI semantic model, and build a dashboard on top of it.
The requirements
To help me understand my site’s traffic, I needed to see a few different points of data. Here’s what I needed:
- A traffic source report:
- I wanted to see the channel grouping (custom definitions), source / medium, and ideally filtered by country.
- I wanted to be able to see conversions as well, even though none are currently set up on my GA4 property. But I wanted this to be flexible and not rely exclusively on the interface definitions.
- A landing page report:
- Which pages were users landing on the most? For this I wanted the page title and page path.
- I wanted this to be filtered by the landing page URL, channel grouping, source / medium, and country as well.
- A page report:
- This is largely the same report as the landing page one, but focuses on pages in general, rather than where users landed only.
- User report:
- Which country are most of my site visitors from?
- What devices are visitors using to view my site?
- A/B Test report:
- On my site I have set up an A/B test tracking setup which I also wanted to visualise.
- You can find the article here: https://lesnich.com/blog/a-practical-guide-to-a-b-testing-with-google-tag-manager/
None of them are anything out of the ordinary, and other than the A/B testing report, all of the reports are already available in the GA4 UI.
To build this data model, I needed a set of fact and dimension tables. For fact tables I needed at least the below:
- sessions
- events
- ab test sessions
I also needed the following dimension tables:
- date
- traffic source
- device
- geographic (information about visitor location)
- page
- ab test information
Key design principles
There were a few key design principles I followed during this process.
Idempotency
One rule I held myself to the whole way through is that the pipeline should be idempotent. This means that when rerunning the pipeline on unchanged data, the pipeline run must never duplicate rows or cause drift.
Another set of decisions revolved around how to address changing dimensions mid-session. This includes session-level aggregations for device data, location, and landing page data. In these cases, I went with the first record as sorted by the event timestamp to keep the output consistent across multiple runs.
Dimensional Modelling
Dimensions should be modelled out and kept in separate dimension tables and joined back using the dimension’s unique key.
Getting the surrogate keys right
Every dimension needs a stable key, and an easy approach is to just hash the business key. That would work fine, but in this case I opted to go for the recommendation provided by Kimball. This meant setting the dimension key as a meaningless and sequential integer that’s assigned to each row.
The one exception is the date table, which Kimball explicitly exempts from this rule.
For the sessions table, I also used Kimball’s approach. However, for the events fact table, which would not be used for any joins, I used a hash of a composite key from the table. Kimball states that composite keys are generally sufficient for fact tables. In this case, I took it a step further, and hashed the key as well.
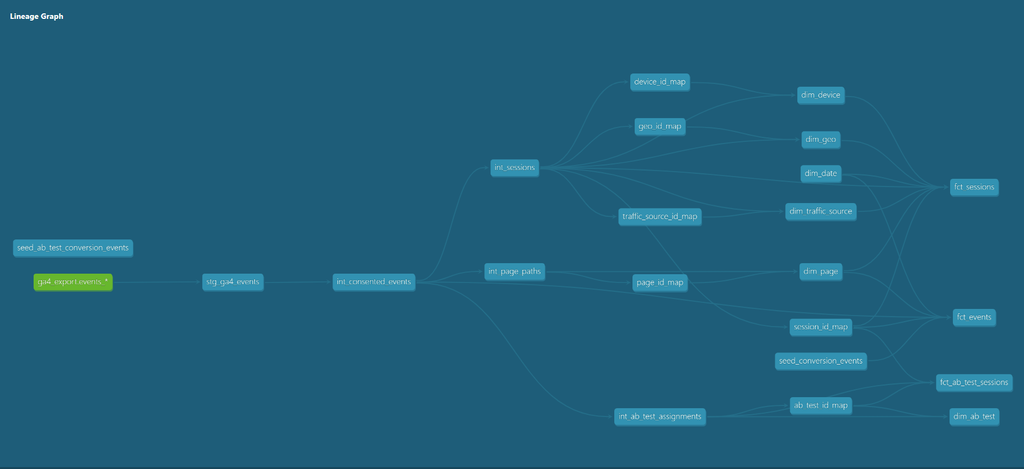
The model’s lineage graph
What I ended up with is a conformed star schema, but split across three related areas rather than one big table: sessions, individual events, and A/B test assignment. They all share the same core dimensions (date, page, traffic source, geography, device), so a session and the events that happened inside it can still be sliced the same way in Power BI.
Data quality problems I only found because of testing
Whilst defining the pipeline, I also added a number of tests to ensure the model’s data is correct and doesn’t violate my own assumptions. I primarily used the “unique” tests and also referential integrity tests.
During testing, a handful of failed “unique” tests turned out to be genuinely useful at finding issues with the data:
- A device changing mid-session. One session showed two different device categories, which shouldn’t be possible. Turned out it was me, toggling my browser’s device emulation from desktop to mobile while checking the site’s responsive layout, which changes what GA4 sees without actually starting a new session. Good reminder that even a reasonable assumption like “a session can’t span two devices” is not always true.
- Duplicate event delivery. One custom event fired multiple times in a single batch, all with an identical timestamp. Rather than assume that away, the pipeline now explicitly deduplicates within a single load, because GA4’s export can actually deliver the same event more than once.
Handling Consent
On my website, GA4 has advanced consent mode set up. This means that when a user rejects cookies, anonymised hits (called cookieless pings) are sent to GA4. As a result, the raw data will include many hits where the user identifier is null.
For this model, I have decided to exclude anonymised hits. The data will still sit in the raw tables, and I plan to revisit handling the anonymised data later.
Current state and next steps
You can find the repository with the dbt project here.
The full star schema, sessions, events, and A/B test assignment, is built and tested, and the Power BI report on top of it is done. I go through the report itself in my next article, covering the layout, the chart choices, and the problems exposed in the model whilst designing it.
Leave a Reply