Since GA4 was first introduced, a commonly touted benefit was the ability to export the raw event-level data, and create your own analysis with that data. This is amazing! We were finally able to customise every part of our reporting. We could also easily join the data with other data sources. High fives all around!
The reality though, is that in many businesses this advanced setup is not always pursued, and many smaller businesses think that the added benefit of getting the raw data isn’t always justified.
Add to that, that because it’s so flexible, there isn’t one way to get started with analysing raw GA4 data. You could write SQL queries to get the exact answers you’re after and be done with it. But you could also go down the more flexible rout and build a semantic model that is flexible and can get you most if not all your answers more easily. The latter may incur more costs since you’ll have more data to be processed with every query, but when you need to scale your operations, the additional compute may be justified, especially after optimising the model.
Why I built this
I wanted to build a dashboard using Power BI with the GA4 data I have collected on this site. There isn’t much data, but having the flexibility in the way I visualise my data would be a fun project.
For this report to work, and be flexible, I needed the model to follow proper dimensional modelling techniques. Since the transformations necessary would be highly interconnected, I decided to use one of my favourite tools: dbt. It would allow me to build, test, and run my model whilst handling the dependencies of each step.
solutions architecture
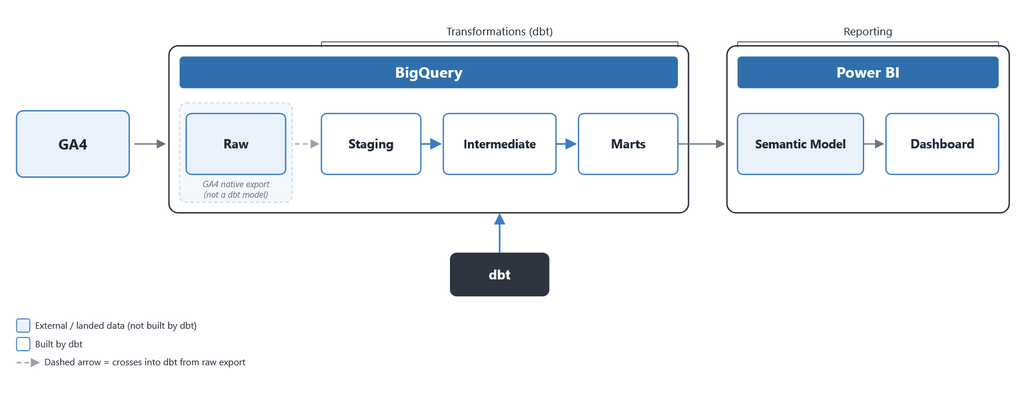
Here’s the shape of the whole pipeline, top to bottom. GA4 pushes its raw event data straight into BigQuery on its own, that bit is just Google’s native export doing its thing, dbt has nothing to do with it. Everything after that is where dbt takes over: staging cleans up and standardises the raw event stream, the intermediate layer does the heavier lifting (working out sessions, resolving identity, handling all the awkward edge cases), and the marts are the actual star schema that Power BI connects to.
The shape of the model
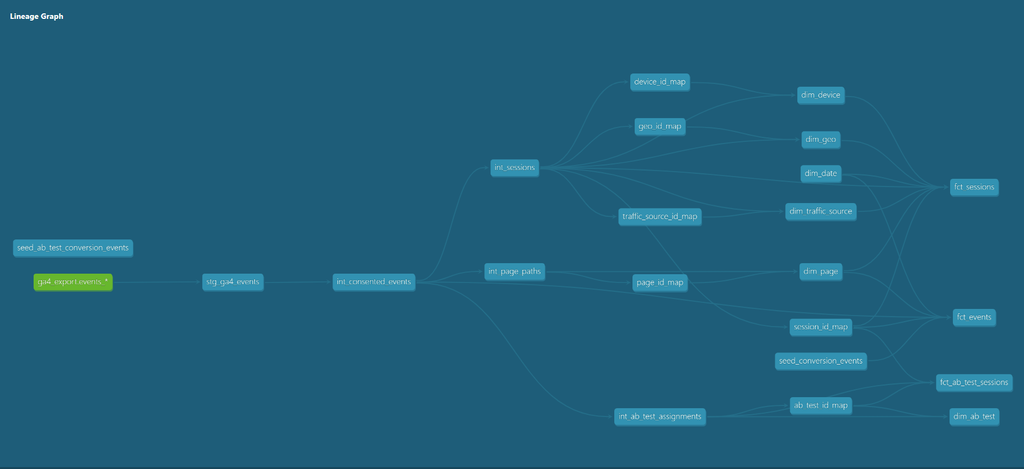
What I ended up with is a conformed star schema, but split across three related areas rather than one big table: sessions, individual events, and A/B test assignment. They all share the same core dimensions (date, page, traffic source, geography, device), so a session and the events that happened inside it can still be sliced the same way in Power BI.
Getting the surrogate keys right
Every dimension needs a stable key, and the obvious move is to just hash the business key. That works, but it’s not the only option, and it’s not free of trade-offs either.
I ended up using two different approaches depending on the situation:
- A persisted, append-only key-mapping table, for dimensions and other business keys that grow slowly (traffic source, page, device, geography, session). New keys get the next available integer, and existing ones never get reassigned, even if I rerun the whole thing. That stability matters a lot if any of the fact tables ever become incremental, since a dimension key shifting on rebuild would quietly break every historical join.
- A plain deterministic hash for the event grain, since that one is unbounded and high volume. A persisted mapping table there would end up roughly as big as the fact table itself, for no real benefit, nothing else in the model needs to relate back to one specific event row.
Neither one is “correct” on its own. It really comes down to whether something else in the model needs to treat that key as a parent, and how fast the underlying values grow.
Data quality problems I only found because of testing
A handful of failed “unique” tests turned out to be genuinely useful at finding issues with the data:
- A device changing mid-session. One session showed two different device categories, which shouldn’t be possible. Turned out it was me, toggling my browser’s device emulation from desktop to mobile while checking the site’s responsive layout, which changes what GA4 sees without actually starting a new session. Good reminder that even a reasonable assumption like “a session can’t span two devices”, is not always true.
- Duplicate event delivery. One custom event fired multiple times in a single batch, all with an identical timestamp. Rather than assume that away, the pipeline now explicitly deduplicates within a single load, because GA4’s export can actually deliver the same event more than once.
None of these showed up just from reading the code. They only surfaced once real data pushed back against what I’d assumed.
Handling Consent
Beyond fixing that identity collision bug, I wanted the model itself to reflect the consent decision explicitly, rather than pretend it doesn’t exist. Core reporting only includes hits with explicit analytics consent. Any hits where users had not explicitly granted consent is excluded from the star schema. However, nothing gets deleted. It all just stays in staging in case I ever want to model that traffic separately down the line.
Key design principles
There were a few key design principles I followed during this process.
- Idempotency:
- One rule I held myself to the whole way through is the pipeline should be idempotent. This means that when rerunning the pipeline on unchanged data, the pipeline run must never duplicate rows or cause drift.
- Another key set of decisions were revolving around how to address changing dimensions mid-session. This includes session-level aggregations for traffic source data and device data (as noted above regarding my testing). In both cases, I went with the first record as sorted by the event timestamp to keep things consistent across multiple runs.
- Dimensional Modelling:
- Dimensions should be modelled out and kept in a separate dimension table and to be joined back using the dimension’s unique key.
Current state and next steps
You can find the repository with the dbt project here. The full star schema, sessions, events, and A/B test assignment, is built and tested. I’m now building the Power BI report on top of it.
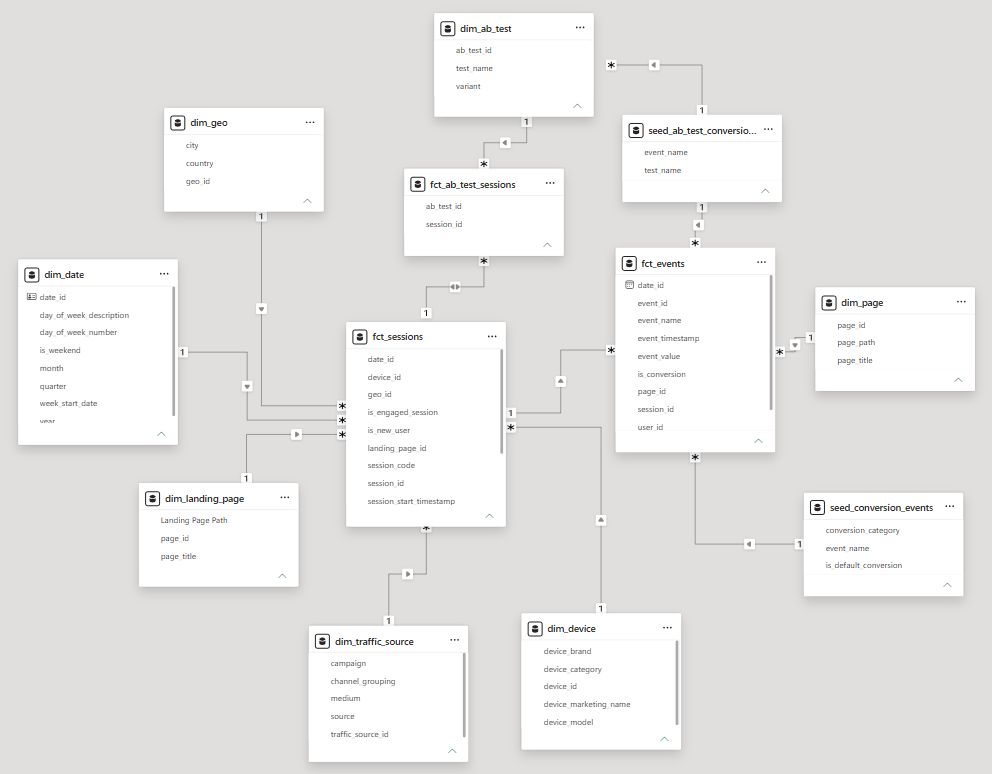
The Power BI Semantic Model is already built, which you can see a screenshot of below.
I’m now focusing on building the rest of the report to visualise the data in an easy-to-digest way that’s easy to interact with.
Leave a Reply